Earthquake Stats
Earthquake Stats: Magnitude 5.7, Friday, July 19 2013 at 9:06:39 am
This morning’s earthquake shook a good bit of the country including myself. We have so far collected 6556 Felt Reports - thanks to all who have submitted them. We’ve been using a couple of new things to monitor the web site and this has been their first real work out. Here’s what we saw.
Real User Monitoring with Pingdom
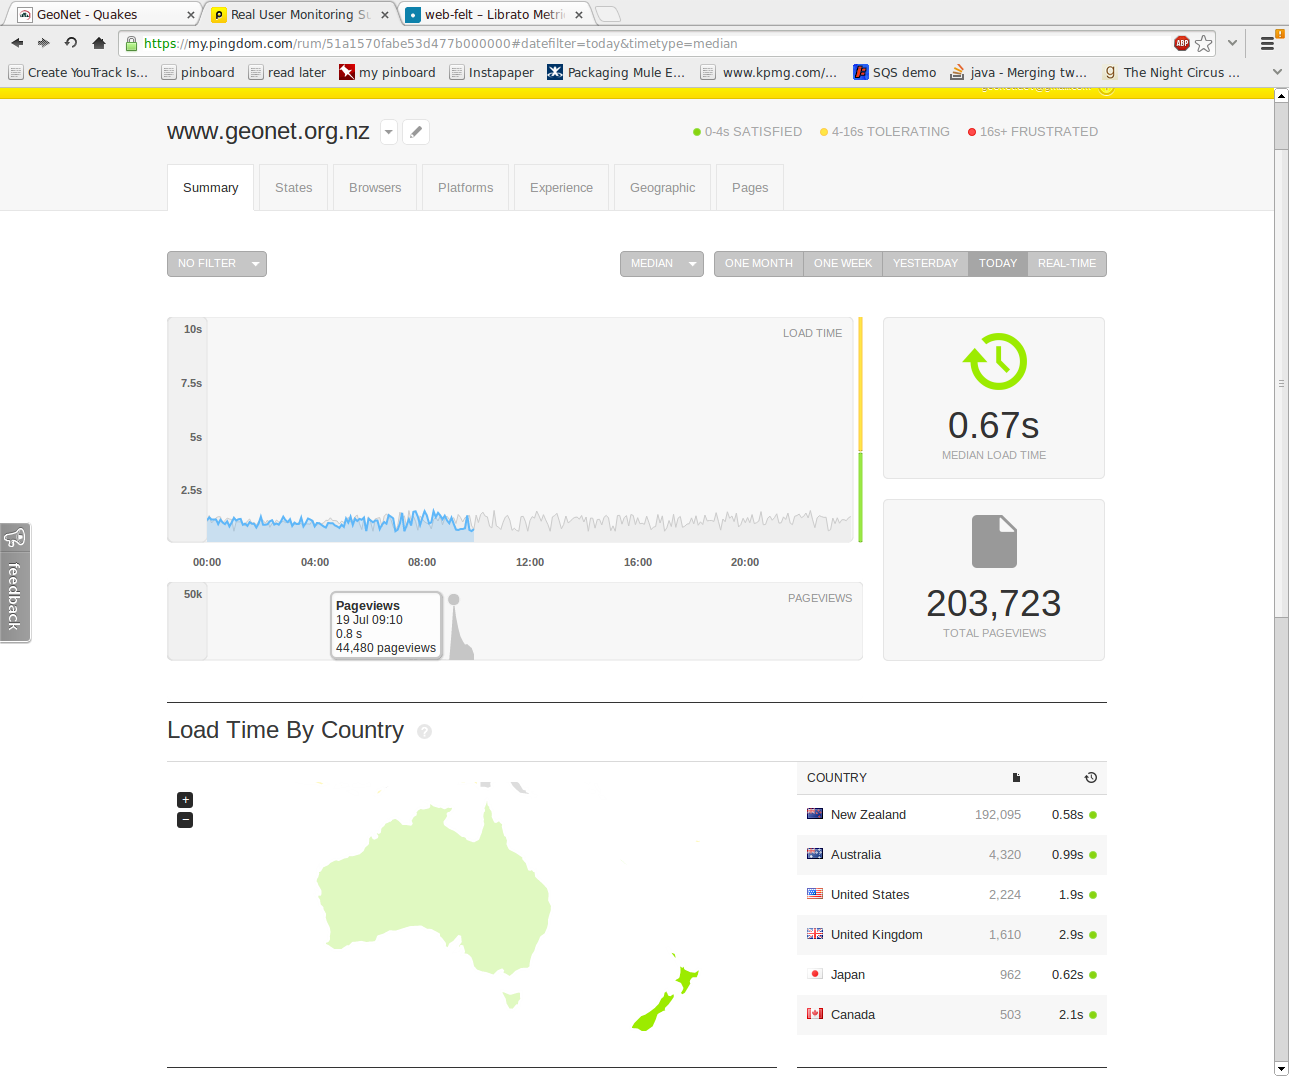
We’re using Pingdom for Real User Monitoring (RUM). This lets us find out how the web site performs from your point of view, in the browser. As I’ve written before we spend a lot of time on web site optimization and RUM with Pingdom gives a window into the results of that (and nothing else, we’re not tracking you here, just web site performance). RUM is a big improvement over what we used to do (post processing server logs with awstats) because we get to see page loads and how long they take in the browser in real time instead of just requests per second. Here’s what it looked like for this morning:

The top graph shows page load time in the browser. The darker blue line is today, overlaid on yesterday (the lighter grey line). The median page load time over this time period is 0.67s. Fast! The graph below this shows the number of page views in 5 minute windows. The traffic goes from the usual low background to 44,480 views in 5 minutes very very quickly. Below the graphs is a map showing page load time by country. What’s really nice is when the traffic hits the page load time doesn’t go up - in fact it goes down a little, probably due to improved caching.
We also use Pingdom for uptime monitoring on our web servers.
Application Server Monitoring for Felt Reports
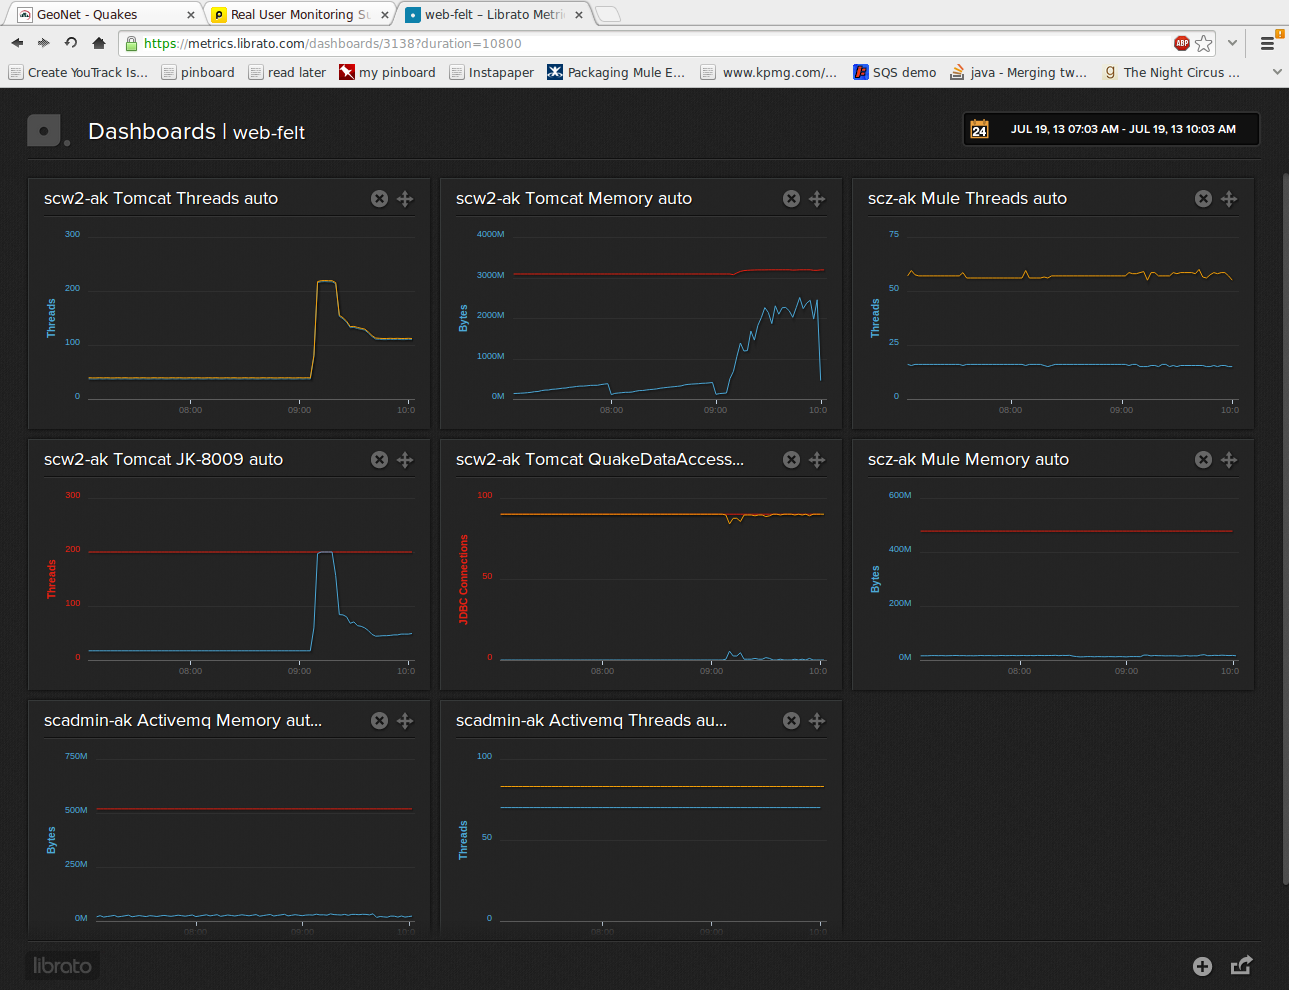
The application that collects Felt Reports got overloaded for a little while. Thanks for your patience in submitting them. To monitor the application server that hosts Felt we use two tools. The first is Jolokia which provides a JMX-HTTP bridge. If you’ve ever worked with JMX and the inevitable firewall issues you will know what I mean when I say that Jolokia is breath of fresh air for JVM monitoring. With Jolokia in place it is easy to write a script to query for JVM metrics. We send the metrics to Librato Metrics to store and visualize them. Libarto Metrics provides a fantastic online tool for visualizing any time series data you care to send them. What’s more, for the 100 or so metrics we send at the moment it’s costing about $7 per month - a total bargain. Here’s what we saw this morning:

In the graph Tomcat JK-8009 we see that the Felt app couldn’t create more threads to serve additional requests for about 8 minutes. Everything else was fine. We’d like to never see this happen but it’s a difficult situation to improve. Eight minutes is to short a time to to spin up additional capacity quickly enough to make a big difference and we can’t justify the cost of having extra capacity sitting around doing nothing for most of the time. We’ve got some ideas for rewriting this application but we’re currently very busy working on improving data and data access for science. I hope we will have time to sneak in some work on Felt later this year.
I’ve also been doing a little work recently to modernize the monitoring for our 500 or so remote field sites and that data is going to go to Librato Metrics. If I get time I’ll write about it in the future.
Tools like Pingdom, Librato Metrics, and Jolokia have been very useful for gaining real time insight into our systems. The arrival of great services in the cloud is providing huge benefit for us: we can spend less time building our own monitoring systems and more time focusing on the business problems and, unfortunately, with all these earthquakes business is good.