
Metrics - What's Your App Doing Right Now?
How is your application performing in production right now?
It’s been a long time between updates, work, busy, mumble mumble mumble.
In a minute I’m going to talk about monitoring Java and that’s enough reason to stop reading right now. Fair enough. But before you go:
- How is your application performing in production right now?
- Are you meeting demand?
- If you add more load to a server will it cause application problems?
- Do you know why things fail when they do?
Developers - you are not excused, DevOps is the new now. Code that is not in production and performing well is worthless. If instrumenting your code to collect metrics about it’s performance in production is not already part of your regular work it soon will be. If Java’s not your thing but you get a bit mumble mumble on the topic of how your code performs in production then scan the pictures below and then head on over to Librato Metrics or Hosted Graphite and get busy. They don’t care what metrics you’re collecting they just make it so easy that you have no excuses not get on with it right now.
Here’s a picture. It’s performance metrics for earthquake messages going through the Mule ESB from the SeisComP3 earthquake location system to the web. There is also a heart beat message tracked so that we know everything is still working between earthquakes. There is a lot of information here. Not least of which is it takes about 10 times longer to insert messages into the a database (akapp01) than it does to read them from the file system (akeqp01). This is the sort of information that makes targeting performance improvement, trouble shooting, or capacity planning easy. Without this sort of information you’re left guessing about what to do when something is not right with your application. Guessing only rarely leads to success.
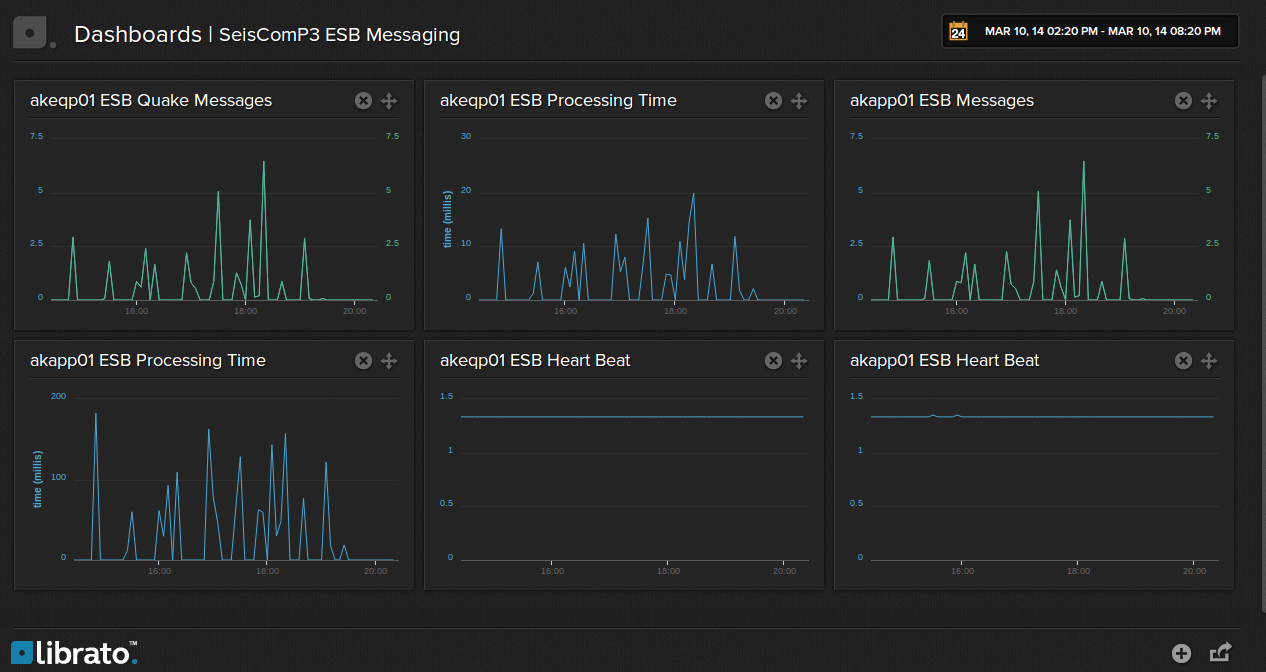
The picture above is a Librato Metrics dashboard. Here’s one of similar information sent to Hosted Graphite.
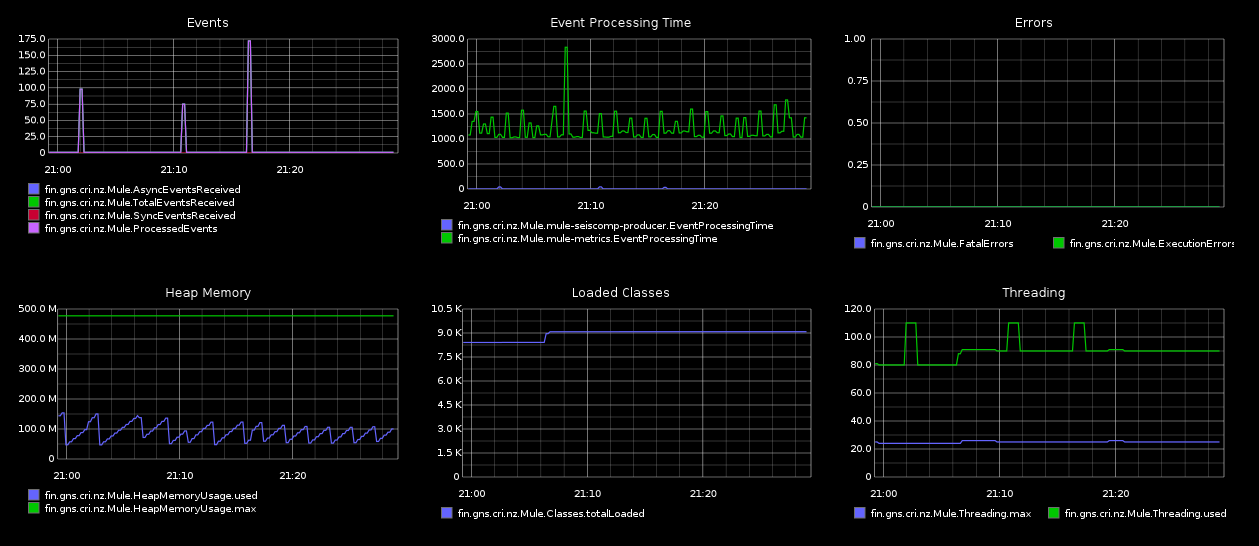
Librato Metrics and Hosted Graphite both have strengths and weaknesses. Try both and see which suits your needs the best. One of the biggest differences, if you need it, is the ability to alert on your metrics.
So to the Java bit. Monitoring the JVM and processes running in it usually involves using JMX. Accessing information via JMX is easy and secure sucks. Running in the cloud, with servers coming and going at a moments notice, makes this problem worse. The obvious answer is to turn the metric gathering problem around and have a JVM agent push metrics to you. There are services available that do this. There is the awesome New Relic and others like it. However, they all come at a cost. Enough of a cost that I ended up rolling our own agent for collecting JVM metrics from Mule, Jetty, and Tomcat.
I didn’t have to do much. Librato Metrics is a great data store with fantastic visualisations for what I want. Getting data out of JMX is the only hard work and fortunately the Jolokia project removes all the pain by providing an HTTP-JMX bridge. I started off with a Jolokia agent being queried with a Perl script. Once I was happy with the moving parts I’ve written agents the wrap Jolokia to run as an application in Mule or a Servlet container and no external script is needed. The applications themselves periodically gather and send metrics to Librato or Hosted Graphite. Getting metrics is as simple as adding some config properties to a server and dropping an app into Mule, Jetty, or Tomcat. Gathering metrics is deploying an application - no fire wall changes, no adding servers to a remote collector process, very little pain at all.
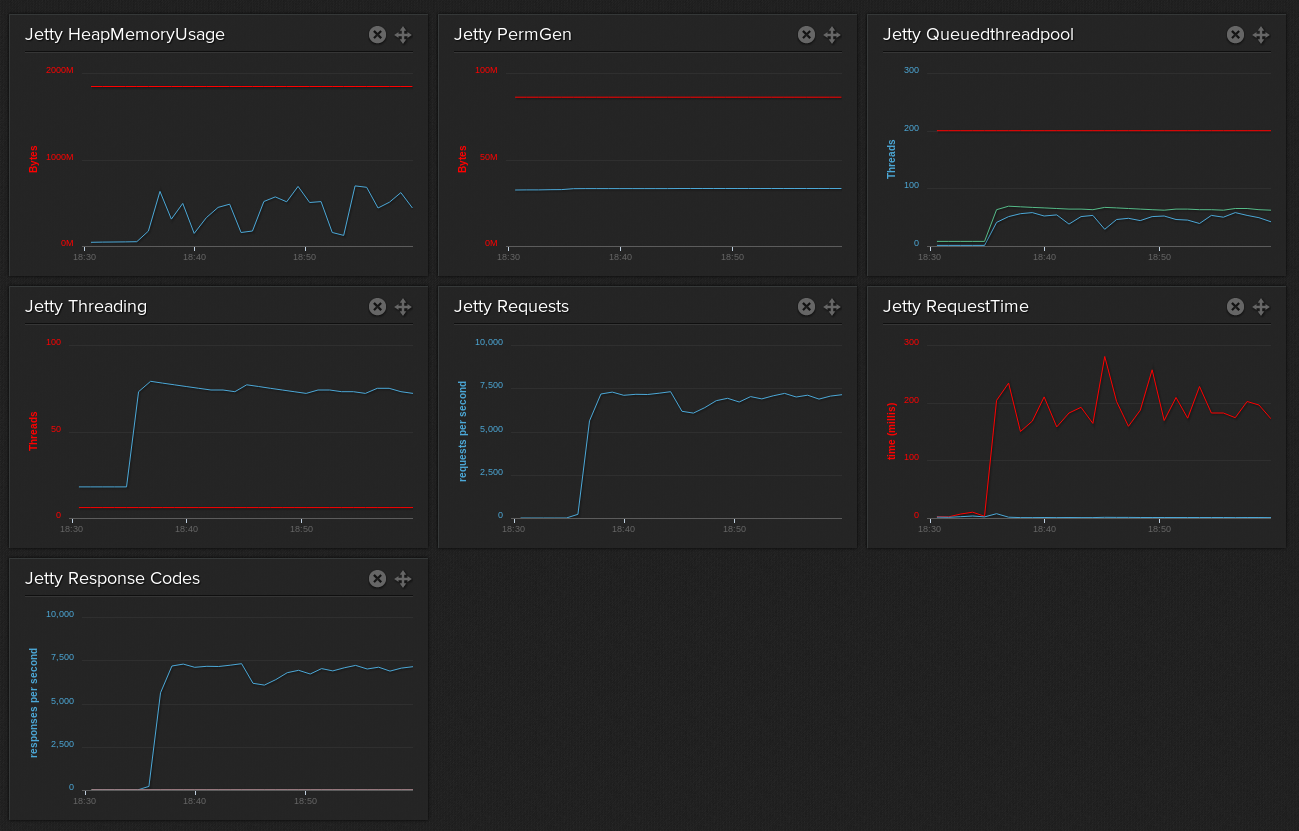
Here’s some Jetty metrics for Jetty and the JVM it’s running in under test load. It looks to me that with a little bit of tuning I could handle a lot more requests with this server.
These are the projects, they are open source on Githib:
If Librato or Graphite are not your thing then Mule Metrics or App Server Metrics should be pretty easy to extend (implement one method). There is a lot more that could be done with Jolokia and JMX beyond using it to extract metrics. As we find places where we need more detail about an application then I think we will start to look seriously at using Coda Hale’s Metrics as we need it. We’re also getting far more sophisticated about how we use logging but that’s a different topic. For now, if you haven’t got it, then work on getting some insight into your applications in production and avoid having to mumble mumble mumble when problems arise.